Data and Diversity: A List Apart surveys
Who created all these websites? What were their job titles? Their ages, genders, ethnic backgrounds, compensation? Did their sex affect their salary? Their title? The speed with which they advanced? If half the people we knew in the business were women, why were so few of them speaking at tech conferences, and how could we change that?
Nobody knows the pixels weve seen
In 2007, we set out to answer these questions. And the first thing we learned was that there was no data, and nobody had even asked the questions. Shockingly, in the 17th year of the webs existence there was not a byte of data to be found about its makers.
The respected research firm we hired to answer our initial questions could not. There was, they told us, no data whatsoever about web designers and developers. They asked us if IT professionals meant the same thing. Of course it doesnt, but they didnt even know that. The internet was practically the only healthy part of the economy at the time, but nobody knew jack about it or the people who made it.
We would have to get our own data. So began the A List Apart surveys, in cooperation with An Event Apartwhich had an interest in getting more great women onstage.
How it worked
We spun up the first survey in 2007. Although our interest in diversity in web design had led us to create the surveys, the surveys presented neutrally, as a series of business questions with no overt agenda. About 35,000 designers responded each year. The surveys were dynamichow you answered a question determined which question you would be asked next, so no two respondents took exactly the same journey.
Slicing and dicing each years results in complex ways enabled us to begin seeing and sharing patterns of power and prejudice in our field.
Painstakingand sometimes elaboratecomputations were required to make the slicing and dicing work. Then we had to write up and find ways to pictorialize the results. The first year we favored difficult, abstract ways of doing thissuch as converting XML data to CSS, care of CSS wizard Eric Meyer of An Event Apart. We included anonymized raw data in a variety of formats so readers could crunch their own numbers and slice and dice to satisfy their own agendas.

Draw your own conclusions
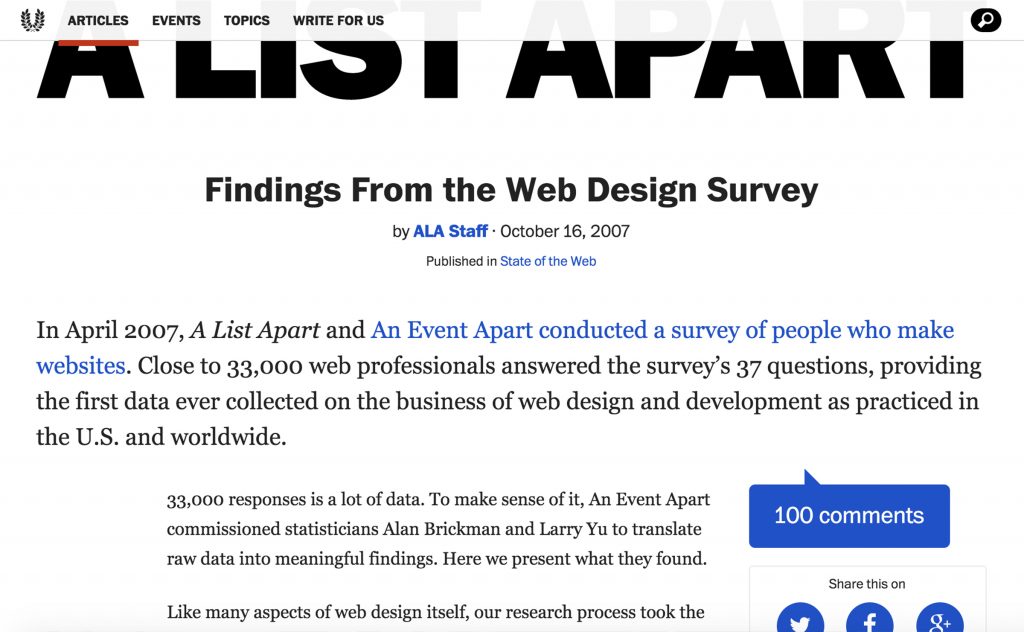
Heres a PDF of the 2007 survey findings in our initial visual style, and here’s the landing page from that year, designed by A List Apart creative director Jason Santa Maria. The presentation style changed after that, and we switched from PDF to web pagesbecause, duh, were a web design firm, ALA is a web design magazine on the web, and An Event Apart is a web design conference.
Enjoy:
- Findings from the A LIST APART Survey, 2008
- Findings from the A LIST APART Survey, 2009
- Findings from the A LIST APART Survey, 2010
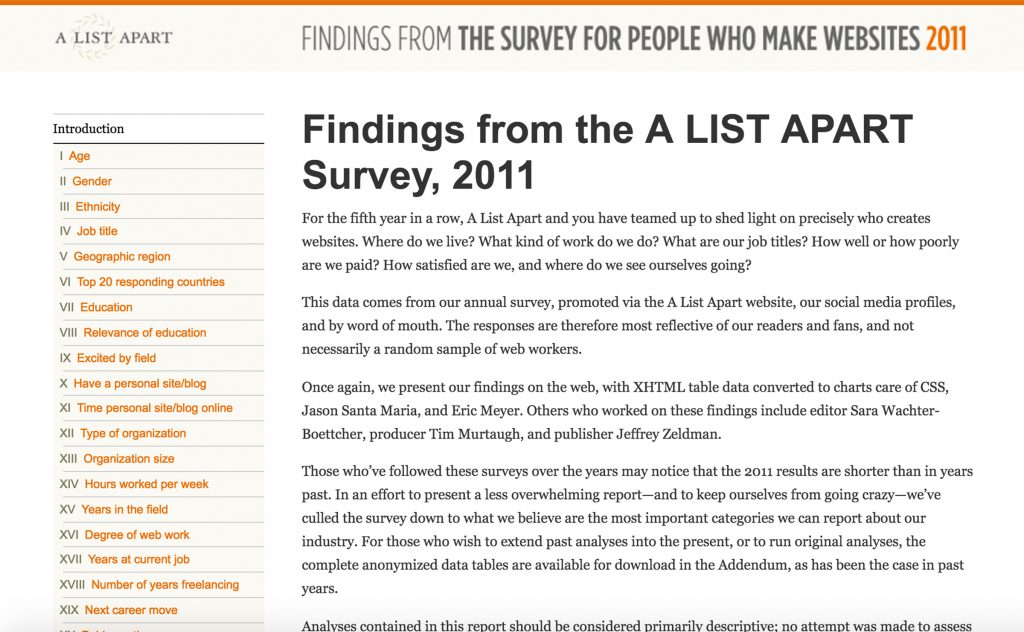
- Findings from the A LIST APART Survey, 2011
In 2011, to stop inventing the wheel each year, we switched from handspun backend tech to PollDaddy, an Automattic product. Using PollDaddy cut out many hours of tedious work preparing handspun questionnaires, but forced us to simplify our question interdependencies somewhat.
By 2012, perhaps because so few data points seemed to change from year to year, the community that had participated so vigorously during the first five years of surveys began to fade. Faced with mounting resource challenges and the indifference of the design, tech, and mainstream press, we have put the surveys on hold for now.